Life expectancy
Life expectancy is a crude index of health. It is reasonably easy to estimate based on historical population data where there is accurate data as to births and deaths. Methods exist that are fairly accurate to estimate life expectancy by survey methods in populations, such as some third world countries where accurate national data does not exists. Such data is important for health care and economic planning. The insurance industry first utilised such data and indeed showed how useful such aggregate data could be. Studies suggest doctors as a group tend to veer to the optimistic side of estimating life expectancy, which perhaps reflects that most of life expectancy is able to be predicted by per capita income and social factors rather than individual healthcare interventions. The availability of such data can be very suggestive of the importance of inequalities in determining health.[1] Preston developed a graphical representation of this issue called a Preston curve.
Preston curves superimposed from 1960 to
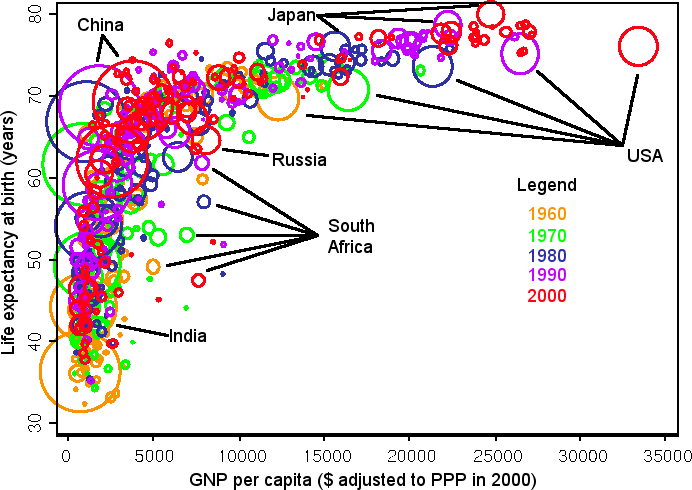
- The gain in life expectancy from reducing early life mortality from malnutrition, infection (including poor water supply) and sewage disposal is marked but does require social cohesion (compare China's progress with India's).
- The gain from social cohesion once health interventions are more directed at non infectious diseases still exists in the more mature economies that can afford such interventions. (compare Japan and the USA).
Each country is represented by a circle proportionate to its total population. Certain important and well known drops in life expectancy are shown. For example in Russia in 1990 with recovery and in South Africa (yet to recover). The advance of China up the third world (low income) portion of the graph is notable, as is India's. About a GNP of $3500 per person at 2000 prices there is a life expectancy transformation. The relatively flat progress in further gain in life expectancy in first world economies after this as represented by the USA. The big 3 European economies (UK, France and Germany) tend to cluster with the UK having slightly lower life expectancy (till 2000 at least). However like Japan they have better life expectancy than the USA. This is consistent with their societies having more social equity.
Links
- Deaton A. Global patterns of income and health: facts and implications
- Deaton A. Global patterns of income and health
References
- ↑ Marmot M. Health in an unequal world. Lancet.368(9552):2081-94 link to registration required